
10 customer service metrics you need to know about

Providing exceptional customer service is key to building loyalty and setting your business apart from the competition.
But it’s not just about friendly interactions — it requires a strategic, data-driven approach. Customer service metrics provide measurable insights into various aspects of service, allowing you to evaluate performance, identify improvement areas, and enhance both customer satisfaction and overall business performance.
This article explores ten essential customer service metrics that you should monitor. You’ll learn what these metrics are, why they matter, and how to use them to improve your customer service operations with informed, strategic decisions.
Understanding customer service metrics
What are customer service metrics?
Customer service metrics are quantifiable indicators used to measure various aspects of service performance, from response times to satisfaction levels. They provide a concrete way for you to assess and enhance service quality.
These metrics act as a barometer for your customer service effectiveness. By collecting and analysing them, you can make data-driven decisions to improve service quality and customer satisfaction.
Customer service quality metrics help you identify pain points and inefficiencies. For instance, a high average resolution time might indicate the need for more efficient workflows. Addressing these issues can streamline operations and enhance the customer experience.
Why are customer service metrics important?
Metrics like customer satisfaction score (CSAT) provide insights into how your customers perceive their interactions with your business. High scores typically correlate with greater loyalty and repeat business, while low scores highlight areas needing improvement to prevent churn and enhance satisfaction.
Customer service performance metrics significantly influence your growth and revenue. Efficient service leads to positive word-of-mouth, increased retention, and higher customer lifetime value. Metrics like First Contact Resolution (FCR) help you identify and eliminate bottlenecks, improving efficiency and reducing costs.
A strong customer service reputation attracts new customers, driving revenue growth. By understanding and making use of these essential customer service quality metrics, you can improve service delivery, achieve sustained growth, and improve profitability.
Top 10 customer service metrics
1. Customer satisfaction score (CSAT)
The customer satisfaction score (CSAT) measures how satisfied customers are with your products or services. Customers rate their satisfaction on a scale, typically from 1 to 5. To calculate CSAT, divide the number of satisfied customers (those rating 4 or 5) by the total number of responses and multiply by 100. This percentage provides a clear measure of customer sentiment and highlights areas for improvement.
CSAT is crucial for your business as it correlates with customer loyalty and repeat business. A high CSAT indicates happy customers, leading to increased retention and positive word-of-mouth. To improve CSAT, focus on upskilling your customer service teams, personalising interactions, and promptly addressing issues.
Additionally, use workforce management (WFM) software to enhance team efficiency. By continuously monitoring and improving CSAT, you can meet customer expectations and maintain a competitive edge.
2. Utilisation
Utilisation is a metric which assesses the productivity of your agents. It measures their ‘productive time’ (in call centres, this is time spent in calls, or performing call-related work) and sets it against their total available time within the same period. By tracking utilisation, you gain a quantitative understanding of how well your agents are spending their working hours.
Usually, utilisation is measured by dividing ‘productive time’ by total time, and multiplying the result by 100 to gain a percentage. The higher the percentage, the better your agents are using their time, but setting targets too high can overtax your agents and lead to burnout. Typical targets for utilisation usually sit at around 80% to 85%, but this can vary by industry and channel. Maintaining good utilisation hygiene makes sure that your resources are being used efficiently, and each member of your team is pulling their weight.
3. First Response Time (FRT)
First Response Time (FRT) is the duration between a customer’s initial contact and your support team’s first reply, measured in minutes, hours, or days. Calculating FRT involves summing all first response times and dividing by the number of tickets, excluding automated responses and requests received outside business hours. Quick first responses are crucial for providing immediate relief and gaining time to resolve issues.
Improving your FRT can significantly enhance customer satisfaction. Quick responses demonstrate to customers that you are attentive and ready to help, even if the initial reply is a simple acknowledgment. To reduce FRT, consider optimising your support processes and tools. Ensure your team has access to organised help documentation and pre-made responses for common issues. Regularly monitor FRT trends and adjust your strategies to maintain a balance that allows your team to respond promptly without compromising the quality of their assistance.
4. Closed per Service Hour
Closed per Service Hour counts the number of customer issues resolved within an hour. These are the fully ‘closed’ issues which have been successfully addressed, without need of a follow up. This metric takes utilisation into account, offering a ‘true’ average in relation to the time spent on service, undiluted with time spent on breaks, meetings, or offline tasks. Bear in mind that more complex inquiries will take longer to close, so you need proper context to draw conclusions and actionable insights when viewing your team’s Closed per Service Hour scores.
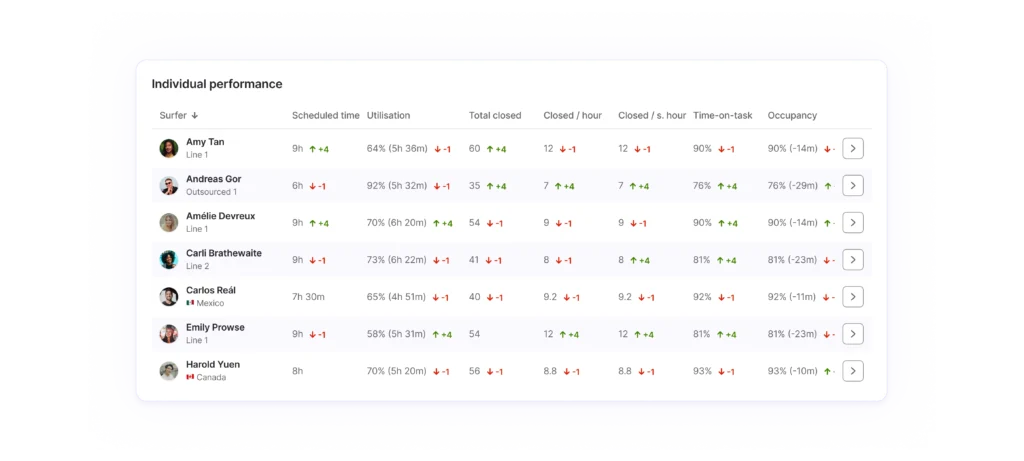
Surfboard’s reporting suite offers you meaningful and actionable insights into your team’s performance by providing a one-stop dashboard to track utilisation, Closed per Service Hour, and many more metrics.
5. Customer Effort Score (CES)
Customer Effort Score (CES) is a key customer service metric that measures the effort your customers must exert to resolve an issue, fulfil a request, purchase or return a product, or get a question answered. CES surveys typically ask: “On a scale of ‘very easy’ to ‘very difficult,’ how easy was it to interact with your business?
The simplicity of CES makes it easy to implement and track across various service and survey channels. This metric provides quick insights into customer loyalty, with lower effort scores indicating higher customer satisfaction and loyalty.
Using CES effectively can significantly reduce customer churn and increase loyalty. High-effort interactions, such as switching channels or repeating information, often lead to dissatisfaction and disloyalty. By identifying these pain points through CES surveys, you can streamline your service processes and enhance customer satisfaction. Sending CES surveys shortly after customer interactions helps capture timely feedback, allowing you to make informed decisions to improve the overall customer experience.
6. Ticket volume
Ticket volume, or total tickets, is a key customer support metric that tracks the number of tickets received over a specified period, including all interactions such as support tickets and social media engagements. Monitoring ticket volume helps identify busy times like product launches or promotions, allowing you to prepare your team. High ticket volume can indicate product issues or successful marketing efforts, making it crucial for efficient operations.
As a business owner, managing ticket volume is essential for insights into product performance and customer satisfaction. Track the reasons behind tickets and share findings with your team. If most tickets are product-related, focus on improving product quality. Additionally, monitor related metrics like customer satisfaction and first response time for a complete view of your support team’s performance. Analysing ticket volume trends helps with staffing decisions, ensuring enough agents during peak times to maintain high customer satisfaction.
7. First Contact Resolution (FCR)
First Contact Resolution (FCR) measures the percentage of customer issues resolved in a single interaction, such as a phone call, chat, or email. This metric is crucial for enhancing agent efficiency and customer satisfaction. To calculate FCR, divide the number of issues resolved on the first contact by the total number of issues, then multiply by 100.
A good FCR rate falls between 70% and 79%, with 80% or higher considered “world-class.” High FCR rates indicate effective problem-solving but also highlight the need for robust self-service resources.
As a business owner, managing FCR is vital for improving customer support. Track FCR to identify patterns and adjust your support strategies accordingly. Training agents, using CRM tools, and implementing automated ticket routing can enhance FCR. However, be cautious of potential pitfalls like quick, temporary fixes that don’t address underlying issues. Pair FCR with other metrics like customer satisfaction (CSAT) and first response time to ensure a comprehensive view of your support team’s performance and to maintain high customer satisfaction and loyalty.
8. Customer retention rate
Customer retention rate measures the percentage of customers who continue doing business with you over a specific period.
Calculate it using the formula:
[(E – N) / S] × 100
Where E is the number of customers at the end, N is new customers acquired, and S is the starting number of customers. A high retention rate indicates satisfied, loyal customers, leading to increased revenue and long-term growth. Retaining customers is more cost-effective than acquiring new ones and is crucial for maintaining a stable revenue base.
Improving customer retention is essential for long-term success. Prioritise customer satisfaction by seeking regular feedback and addressing concerns promptly. Train your team to provide excellent support across multiple channels like phone, email, and live chat. Engage with customers by keeping them informed about new products and promotions, and personalise communications to make them feel valued. Develop a loyalty program with rewards to encourage repeat business. By implementing these strategies, you can nurture loyalty and drive growth.
9. Customer churn rate
Customer churn rate measures the percentage of customers who stop doing business with you over a specific period.
To calculate it, use the formula:
(Customers lost during a period / Total customers at the start of that period) x 100.
This metric is crucial because it highlights customer dissatisfaction and helps identify areas needing improvement. High churn rates can significantly impact your bottom line, indicating underlying issues that require attention to retain customers and sustain growth.
Reducing customer churn is about proactively ensuring customers find value in your business from the start. Engage customers with personalised communication and regularly collect feedback to address their needs and concerns. Implement loyalty programs to incentivize repeat business and maintain long-term relationships.
Additionally, identify at-risk customers using metrics like Net Promoter Score (NPS) and offer targeted support to re-engage them. By consistently delivering value and enhancing the customer experience, you can significantly reduce churn and foster customer loyalty.
10. Employee engagement
Employee engagement measures how committed and emotionally connected your employees are to your business. High engagement leads to motivated, productive employees who provide excellent customer service, enhancing customer satisfaction and loyalty. This, in turn, drives repeat business and referrals, contributing to your company’s growth and revenue.
Improve employee engagement by regularly measuring it through surveys and feedback. Foster a positive work culture by recognizing contributions, promoting work-life balance, and offering growth opportunities. Ensure open communication and invest in employee development programs. These strategies create a motivated workforce that boosts customer support and overall business success.
Analysing and improving customer service performance
Measuring customer service performance
Measuring customer service performance involves utilising a variety of tools and techniques to gather and analyse data. Common methods include:
- Customer feedback tools collect direct feedback from customers about their service experiences, providing valuable insights into their satisfaction and expectations.
- Performance monitoring systems track the efficiency and effectiveness of customer service interactions, offering a detailed view of how well your team is performing.
- Workforce Management Software (WFM) solutions like Surfboard help optimise staffing levels, ensuring customer service teams are adequately resourced to meet demand and maintain high performance. Surfboard helps integrate data from multiple sources, enabling comprehensive analysis and reporting on customer service performance.
Interpreting customer service metrics
Interpreting customer service performance metrics involves analysing the data to understand performance trends and patterns. Key steps include:
- Trend analysis — look for patterns over time to identify areas of improvement or decline.
- Benchmarking — compare metrics against industry standards or competitors to gauge performance.
- Root cause analysis — investigate underlying reasons for poor performance metrics.
Strategies for improving customer service metrics
Improving customer service quality metrics requires specific strategies such as enhancing customer satisfaction by training employees in customer service excellence and fostering a customer-centric culture. Additionally, improving efficiency by equipping agents with better resources and training, and reducing response times by streamlining workflows and providing agents with quick access to information are crucial.
WFM solutions can be key in boosting customer service metrics across the board. Ostrom, a renewable energy provider in Germany, partnered up with Surfboard to improve their customer service.
By switching to Surfboard in May 2023, Ostrom achieved a 4.8-star Trustpilot score. The software’s forecasting features enabled precise scheduling based on ticket volumes, ensuring quick response times and better service levels. Surfboard’s time-off integrations with Personio streamlined scheduling by automatically reflecting absences, allowing Ostrom to maintain optimal coverage.
Book a free demo today to see how Surfboard can measure your team’s performance — and improve it, too.
Book a demoFAQs
What 3 metrics best measure customer success?
The three most important metrics to measure customer success may differ depending on your business needs. For businesses focusing on satisfaction and loyalty, Customer Satisfaction Score (CSAT) and customer retention rate are crucial.
Alternatively, operational efficiency might prioritise First Response Time (FRT), Closed per Service Hour, and Utilisation. Understanding your specific goals will guide you in selecting the most appropriate metrics, with tools like Surfboard helping to integrate these metrics for a comprehensive view of performance.
How do you measure customer service?
Measuring customer service involves using a variety of tools and techniques to gather and analyse data. Customer feedback tools collect direct insights from customers about their service experiences. Performance monitoring systems track the efficiency and effectiveness of customer interactions, providing a detailed view of service quality.
Additionally, Workforce Management (WFM) software like Surfboard helps optimise staffing levels and integrates data from multiple sources for comprehensive analysis and reporting on customer service performance.
How to analyse customer service performance?
Analysing customer service performance involves examining data to understand trends and identify areas for improvement. Key steps include trend analysis to spot patterns over time, benchmarking against industry standards or competitors to gauge relative performance, and conducting root cause analysis to uncover the reasons behind poor performance metrics.
Understanding these data points allows businesses to make informed decisions to enhance service quality and address specific issues. For example, using Surfboard’s forecasting features can help schedule staff efficiently, improving response times and overall service levels.