Measure the value of your support team with Surfboard performance

Shannon Ashley , Design lead
As AI becomes more embedded in customer support, measuring the productivity and output of human agents has never been more critical. Many teams are now seeing lower resolves and longer average handle times from their agents as chatbots handle easy, low-level queries, disrupting traditional measures of ‘good’ in the industry.
As a result, it’s more important than ever for businesses to have a clear understanding of the return on investment and cost to serve related to their support function. Efficiently managed support teams lead to higher customer satisfaction, reduced operational costs, and increased profitability.
We’re excited to share our new additions to Surfboard’s reporting suite, offering teams greater insight into key performance metrics. By accurately measuring productivity, support leaders can identify areas for improvement, optimise resource allocation, and ensure their teams are working at peak efficiency.
Surfboard performance
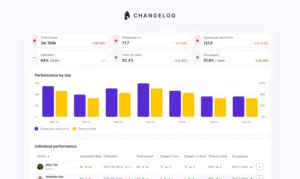
New metrics
We’ve added several new metrics to build on our existing time-on-task (adherence) metric:
- Total Closed
- Closed per Service Hour
- Closed per Hour
- Utilisation
- Occupancy
The importance of measuring productivity with context
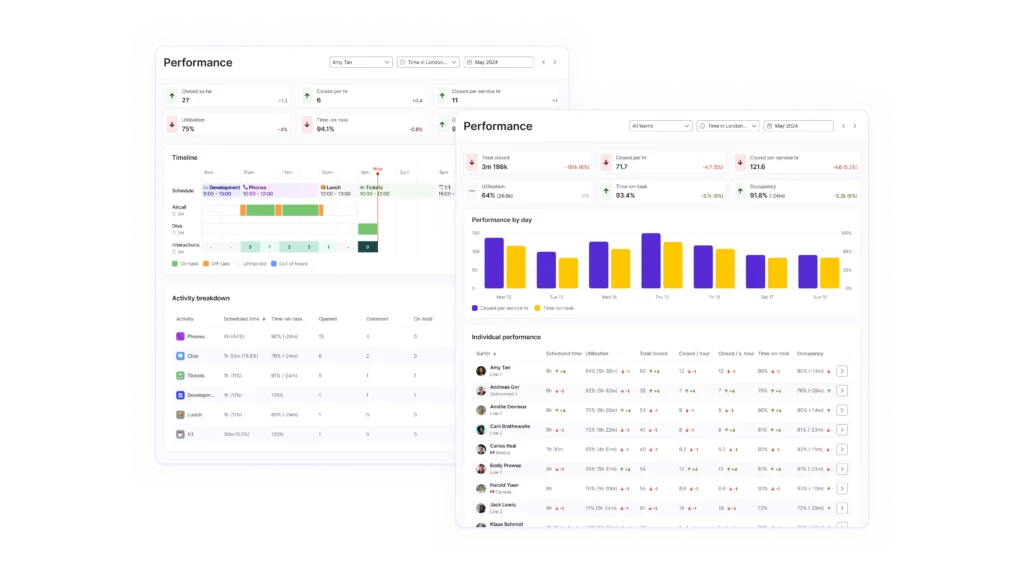
To fairly measure performance across different teams and agents, you need to have the correct context to avoid the trap of ‘comparing apples with oranges’. Utilisation has a huge impact on the potential productivity of an agent and can vary greatly from day to week to month, depending on the needs of the business. Measuring this is key to set the scene, adding insight when comparing outputs.
Surfboard’s new metric, Closed per Service Hour, goes even further by doing the hard work for you; this score only creates a ‘true’ average in relation to the time spent on service—rather than diluting it with time spent on breaks, meetings, or offline tasks.
Measure what matters with Occupancy
Surfboard’s unique adherence metric, time-on-task, offers insight into how much time was spent actively supporting customers. However, depending on your priorities, it may not be crucial if agents are off-task during non-service time. Occupancy provides a focused look into the percentage of service time that was spent on-task, ignoring any activity outside of these times.
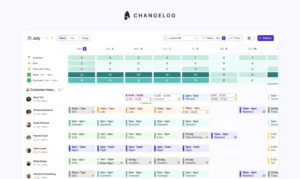
Shift from reactive to proactive management
Customer support operations can often be a game of two halves, and the data available needs to work for both cases. Surfboard’s performance metrics are available in real-time, allowing you to identify and rectify issues and bottlenecks as they occur. Detailed reports and insights over time allow managers to proactively identify behavioural trends across channels, teams, or individuals that can be addressed before a long-term issue develops.
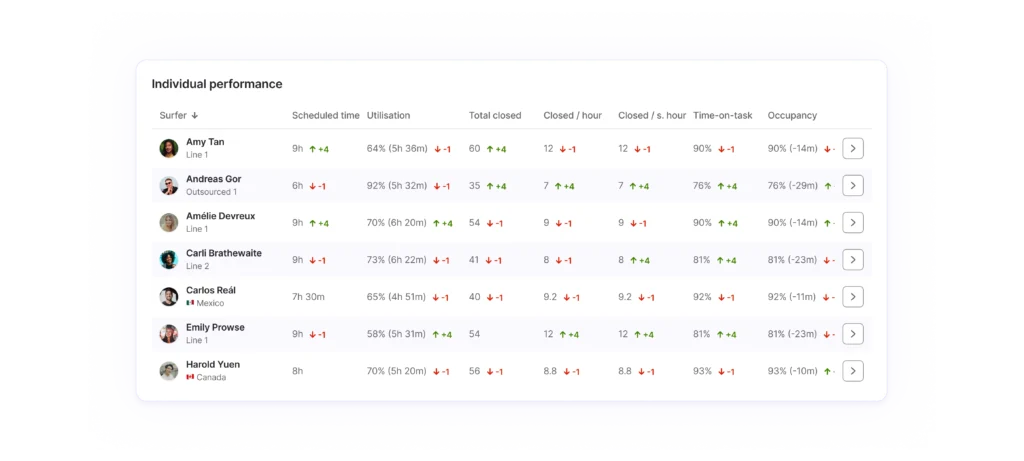
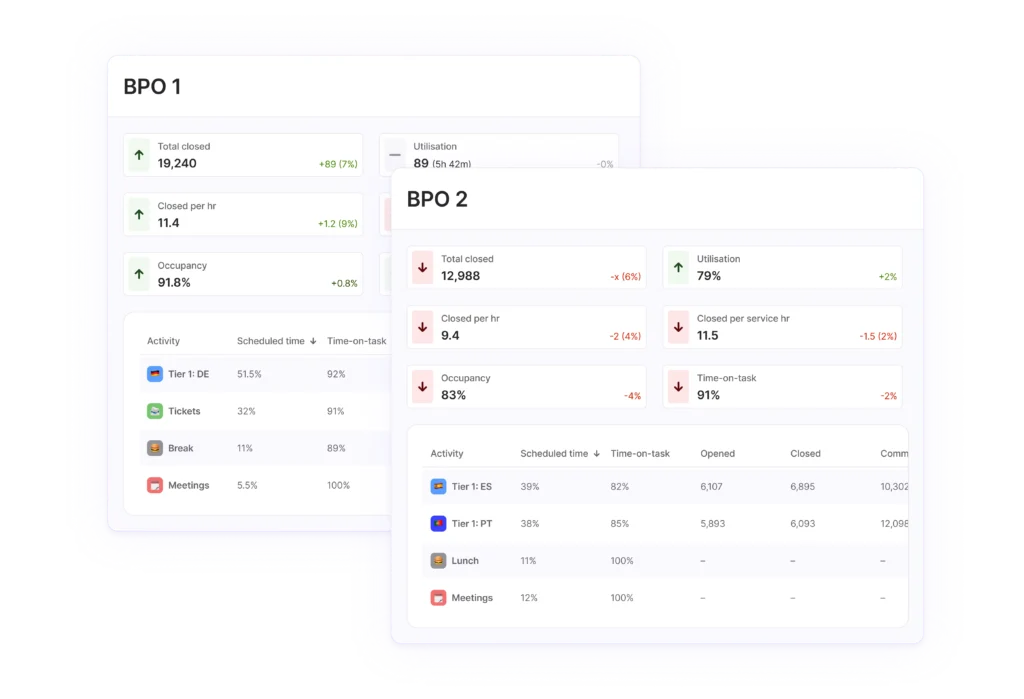
Compare teams and BPOs with ease
Surfboard’s clear and simple reports allow you to easily compare multiple metrics across teams. When working with a BPO, data is key to control costs and evaluate performance. View time scheduled, utilisation, productivity, and occupancy in one simple report, either rolled up as a team average or broken down per agent.
Measuring performance is only one piece of the puzzle
Before Surfboard, many support teams faced issues like:
- Inefficient resource allocation
- High agent turnover due to burnout
- Inconsistent performance metrics
- Lack of actionable insights for real-time adjustments
With Surfboard, these challenges are mitigated through:
- Intelligent Scheduling: Ensuring the right number of agents are available at peak times, reducing understaffing and overstaffing.
- Enhanced Morale: Transparent performance metrics and fair comparisons boost agent morale, reducing turnover.
- Actionable Insights: Real-time and historical data provide actionable insights for continuous improvement.
Surfboard’s new productivity metrics offer a comprehensive solution to measure and improve customer support performance. Investing in Surfboard means investing in a tool that not only measures performance but actively helps in improving it, ensuring your customer support team is always at its best.
For more insights into the metrics that matter, download our free eBook.