Get detailed insights into your scheduling capacity and shrinkage

Natasha Ratanshi-Stein , Founder & CEO
Capacity planning can be time-consuming and difficult. We’ve spoken to many managers who are wasting hours moving data around, creating spreadsheets and custom reports, all to understand how well they’re scheduling their team and what their shrinkage level is.
At Surfboard, we know that data-informed decisions are better ones, and that’s why we’re excited to share our latest feature, Schedule insights.
Designed to empower businesses with key insights into how their team’s time is scheduled, our tool unlocks the power of efficient scheduling, capacity planning and resource allocation in one simple, beautiful view.
Simple service capacity planning
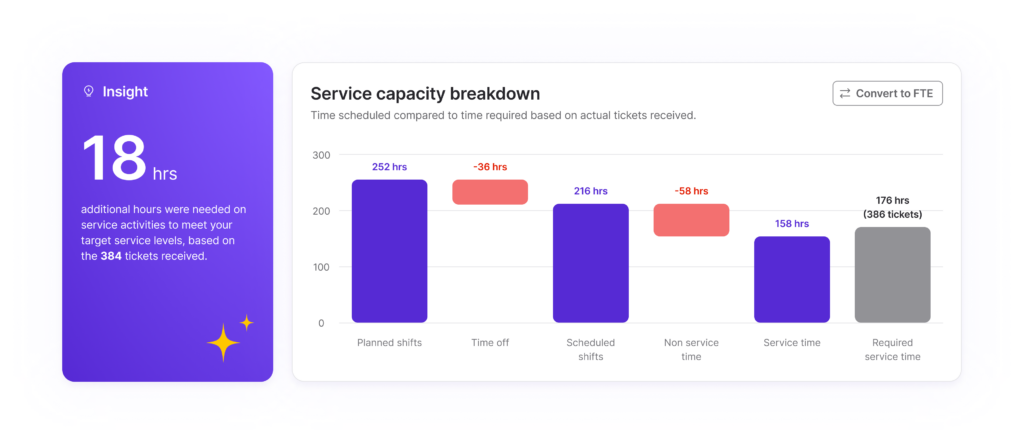
Getting your initial shift and capacity planning right is key to meeting your SLAs and success on the day. Our service capacity waterfall chart makes it simple to understand where your scheduling may have fallen short.
Did you not schedule enough shifts to begin with? Approved too much holiday? Scheduled too much offline time or meetings?
Easily understand where you’re over or under staffed, and the impact that can have on your SLAs. Our flexible tool lets you visualise capacity in agent hours, or FTE equivalent, so you can report in a way that suits your own processes.
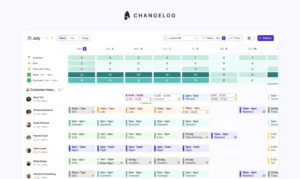
Planning and reporting, side by side
It’s important to plan for the future, but equally as important to perform post-mortems and review what happened.
In the Schedule Insights page, you can seamlessly switch from reviewing your capacity planning in future schedules, powered by forecasts, to reviewing the past, enriched with the actual ticket volumes you received.
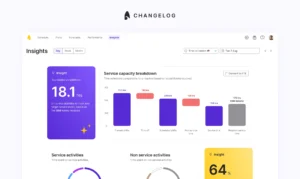
Reduce your costs by reducing your shrinkage
Efficiency matters, and that’s why we’ve integrated an in-depth shrinkage analysis into our Schedule Insights feature. Discover the exact impact of time off and non-service activities on your SLAs.
With detailed metrics at your fingertips, you can identify areas of improvement and implement strategies to reduce shrinkage, ultimately boosting your organisations operational efficiency.
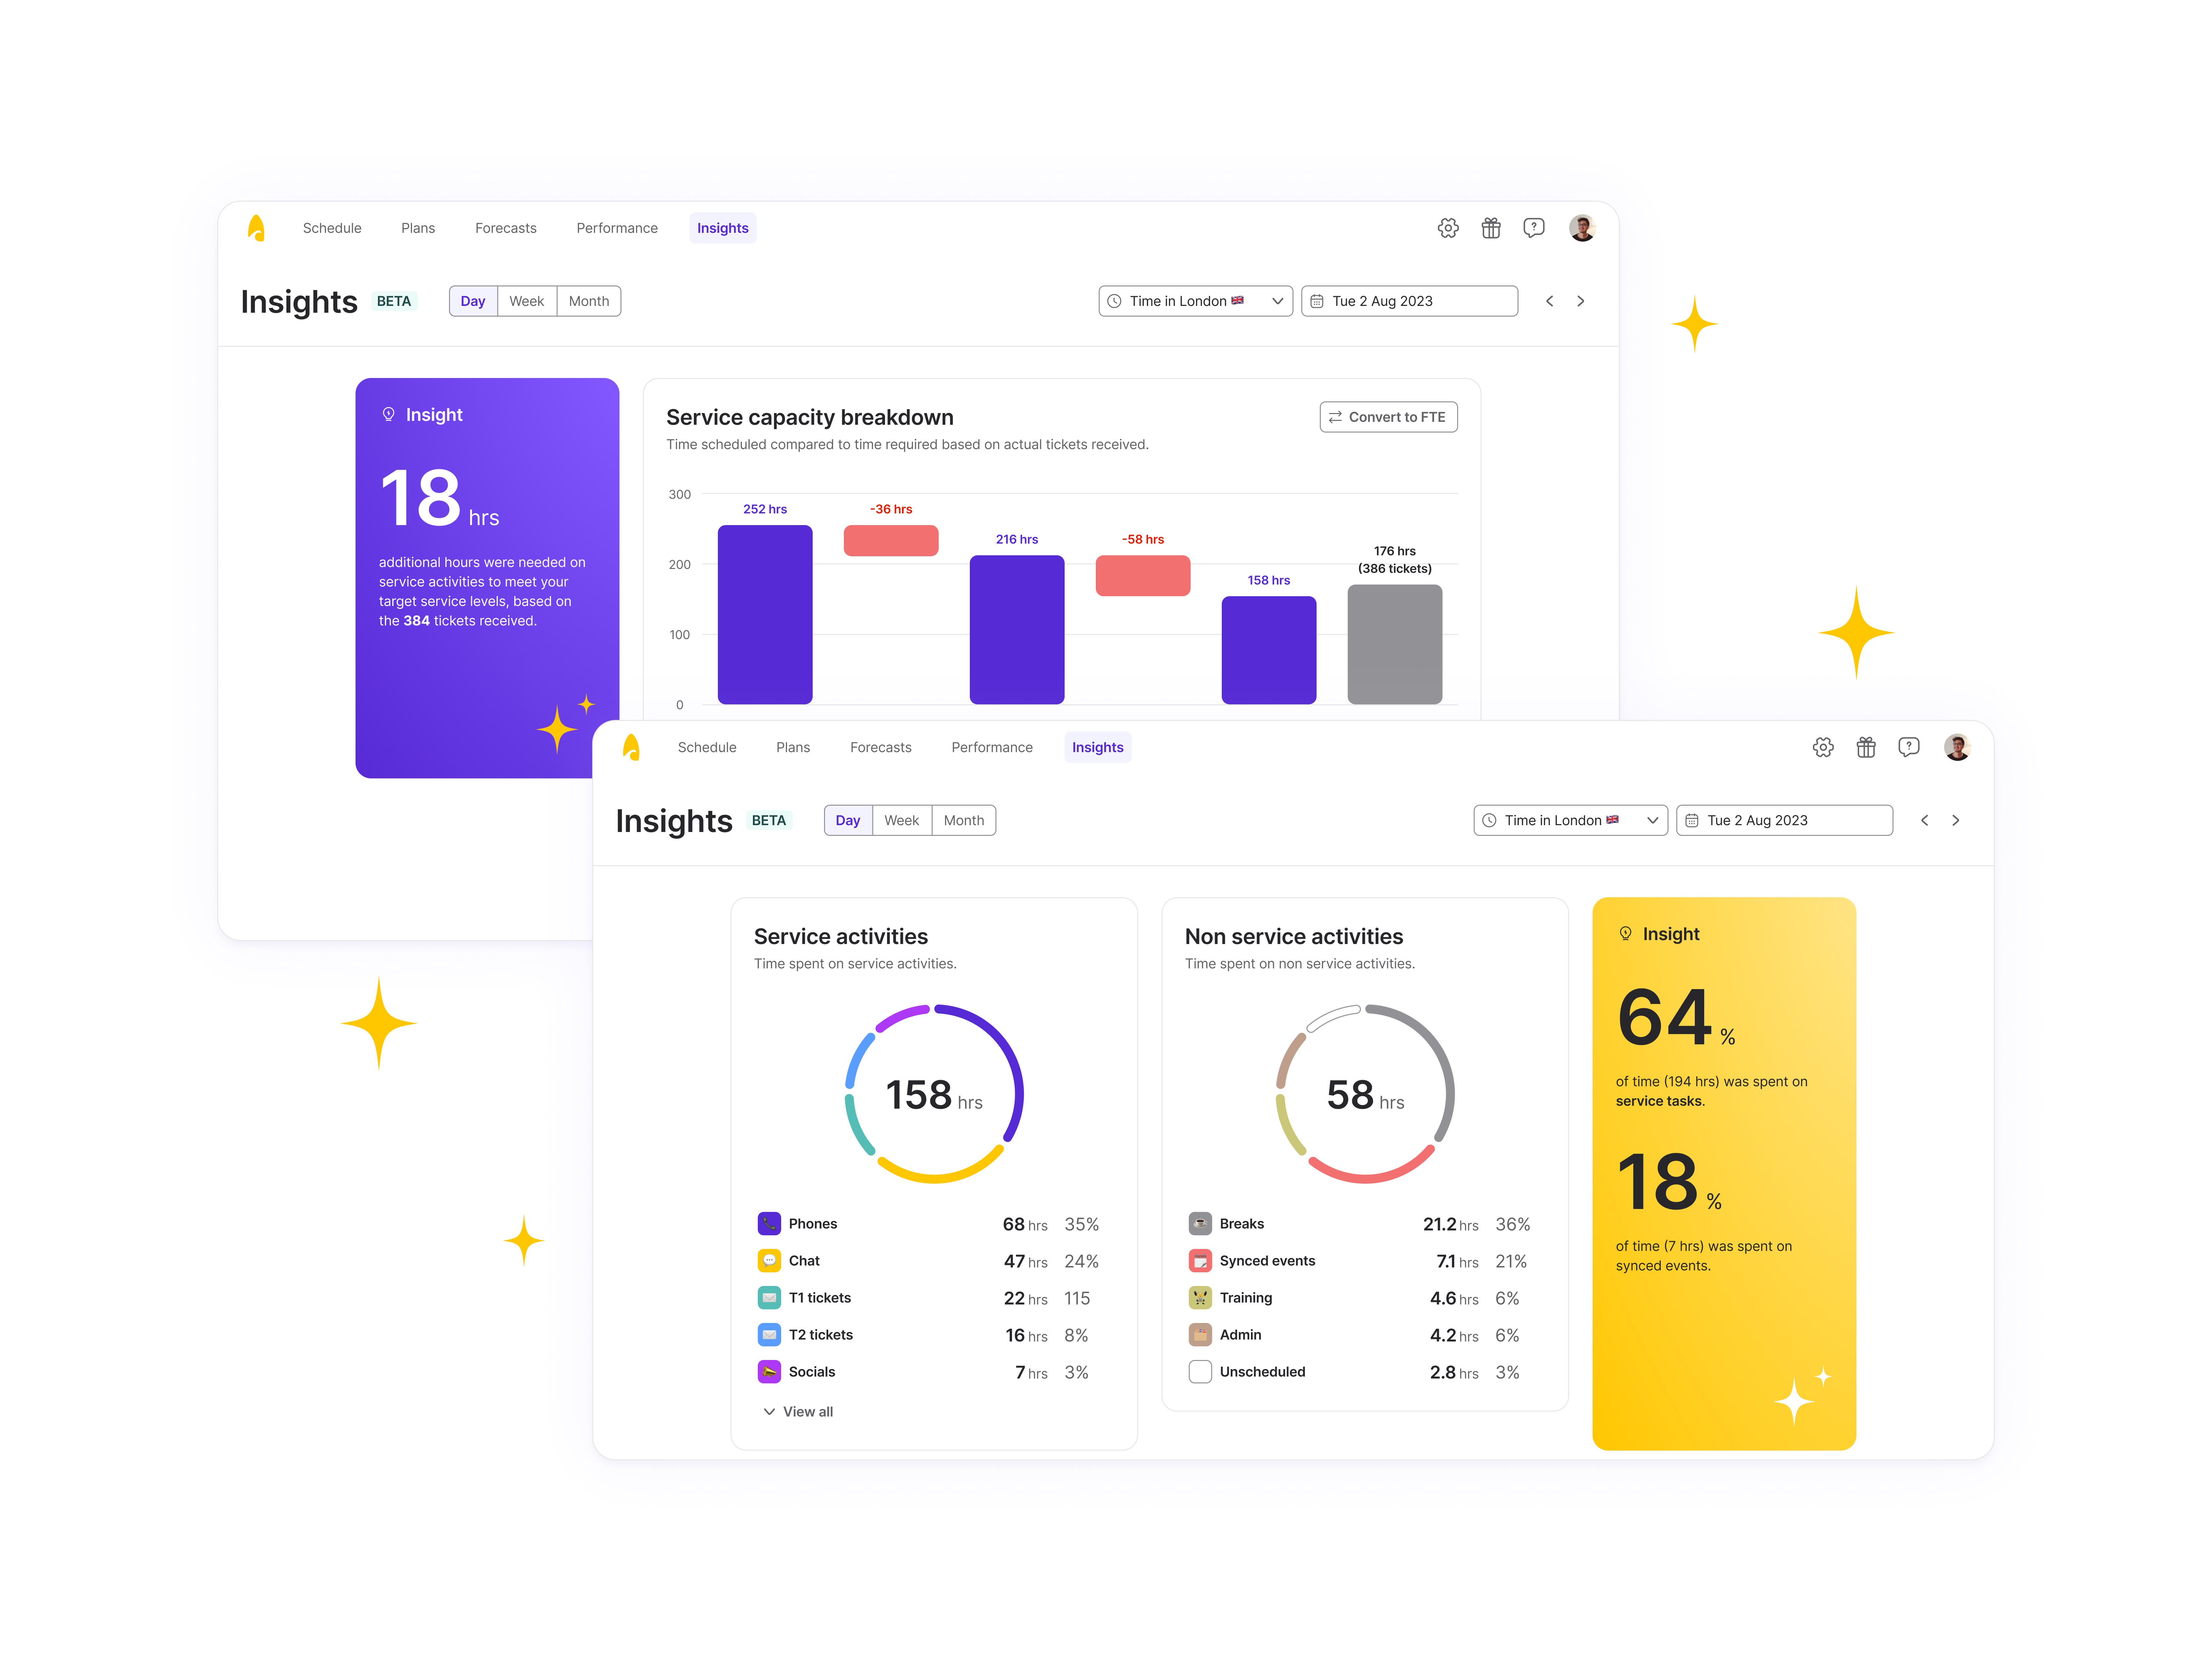
Understand where every minute was spent
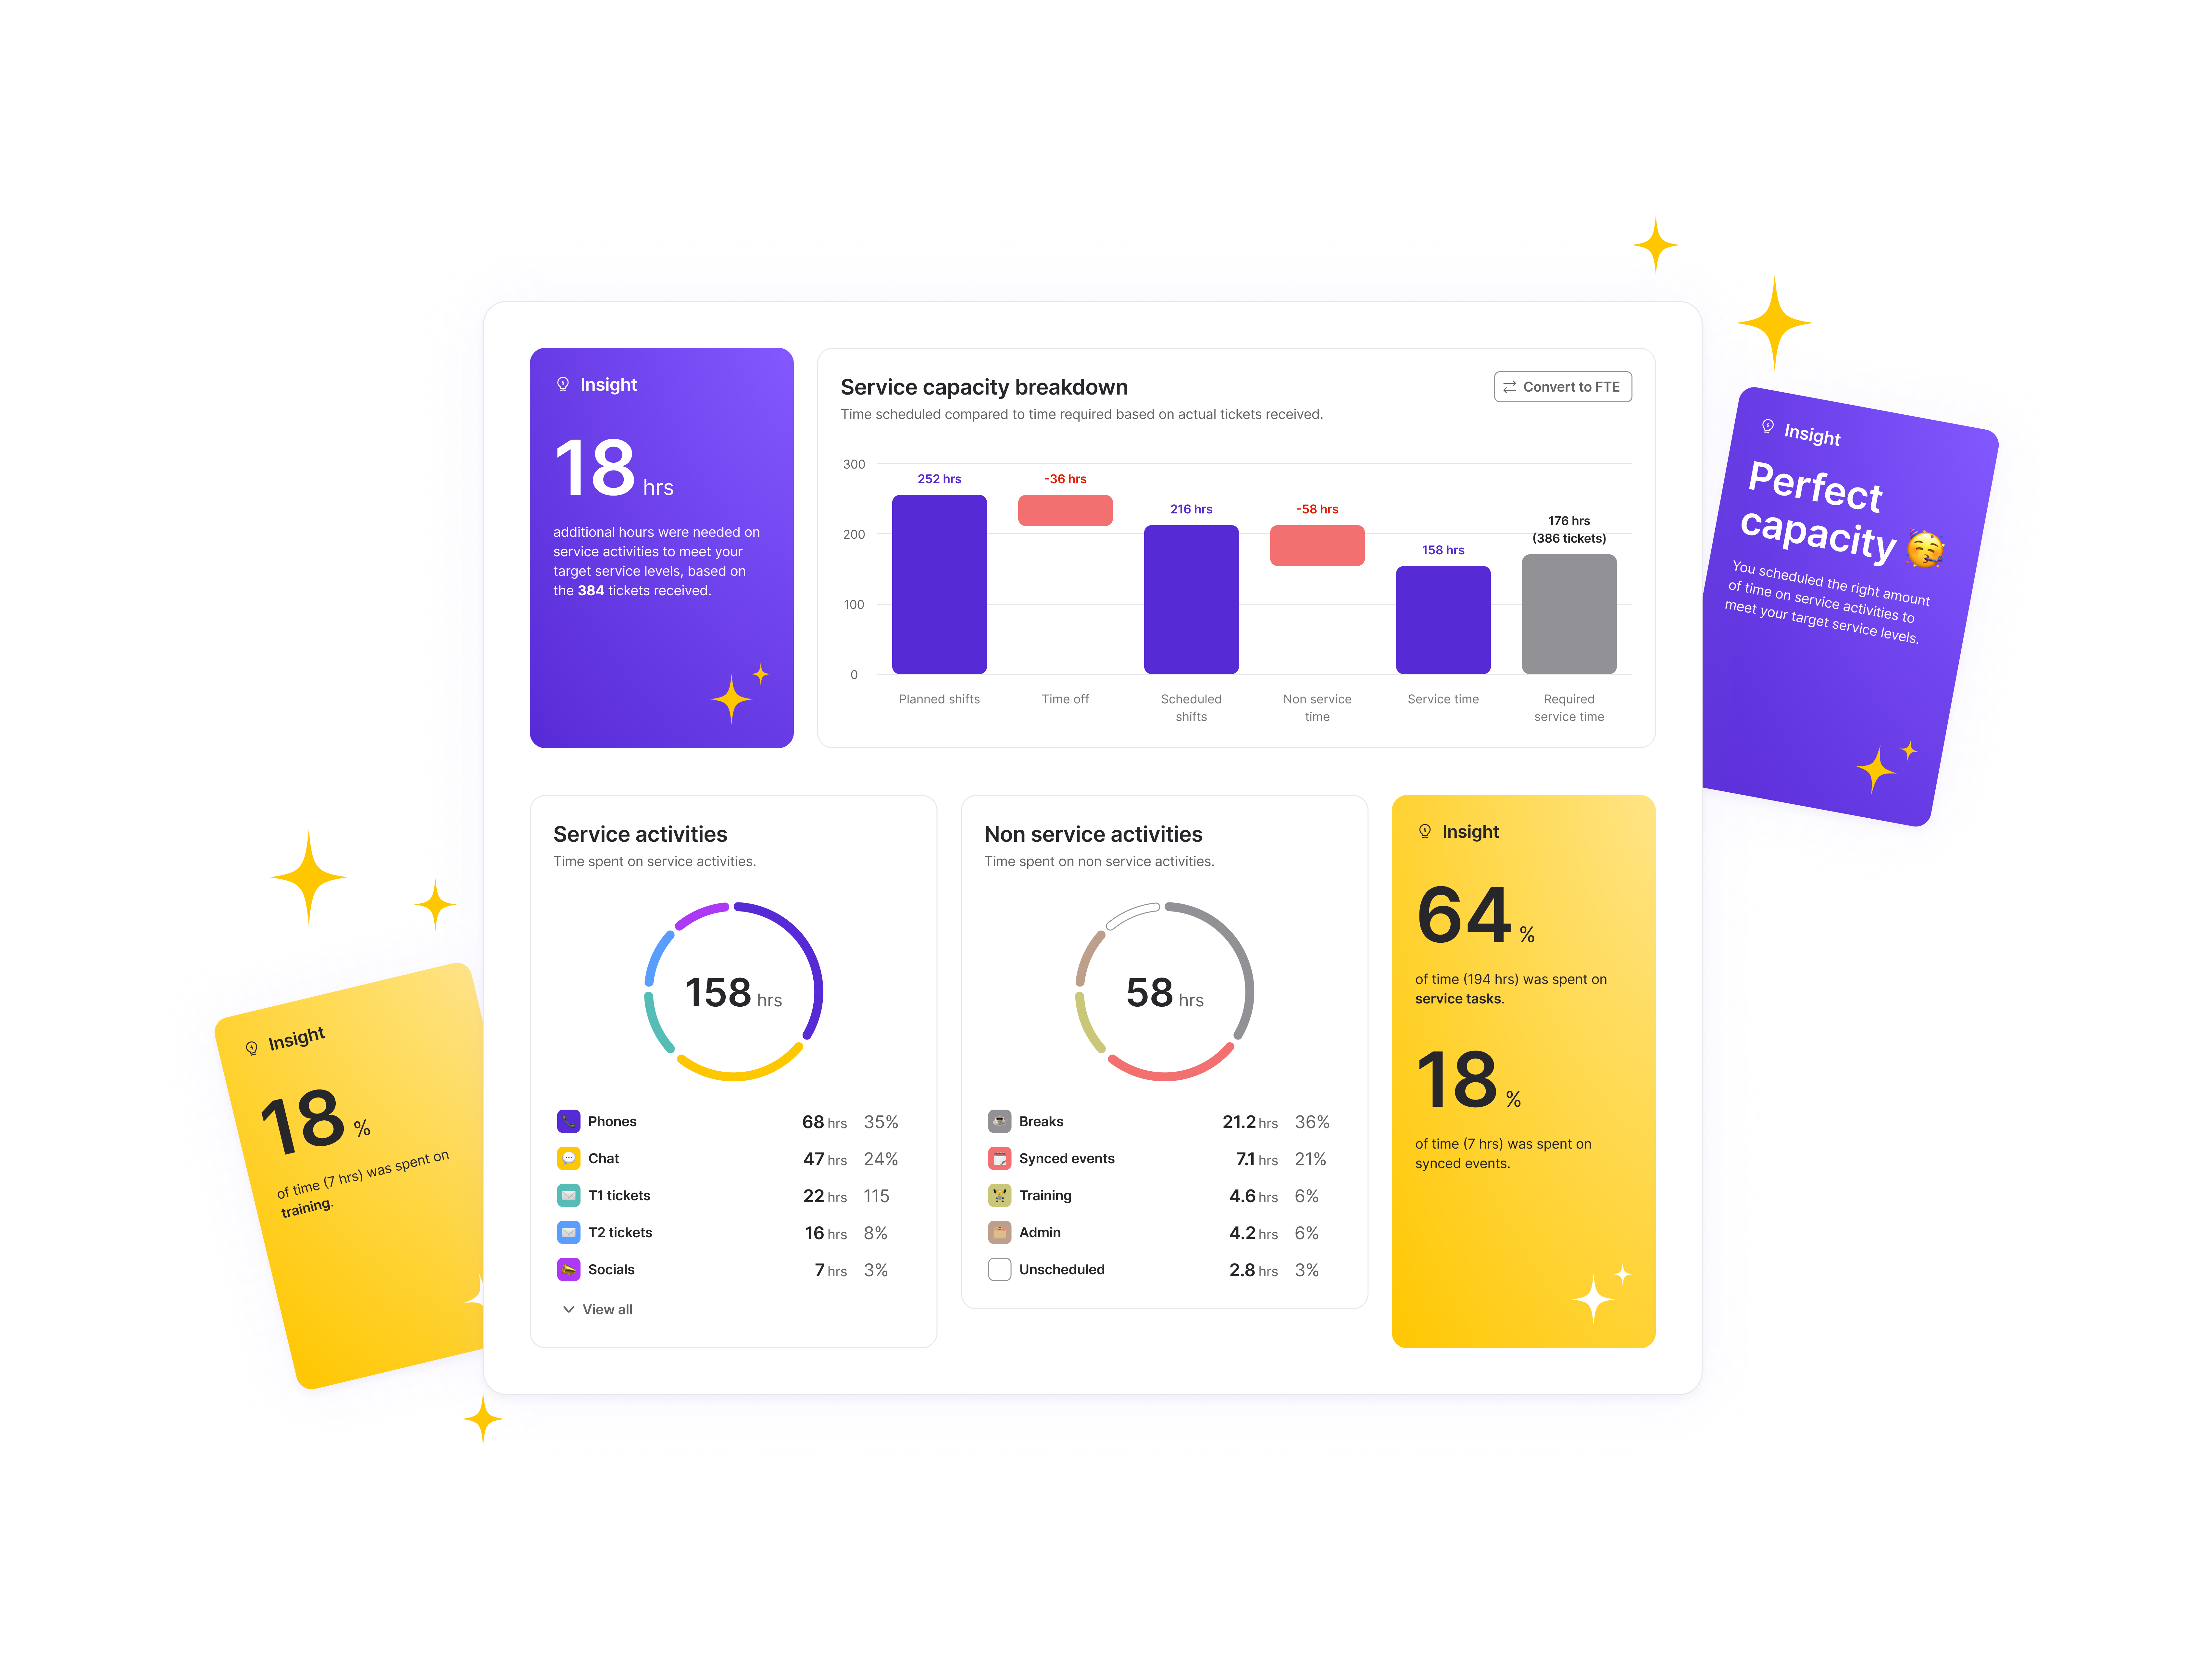
Understanding where your time is allocated is crucial for resource optimisation. Our feature provides you with a comprehensive breakdown of scheduled time across various channels and activities.
Whether it’s customer support, sales, or any other task, you’ll have a clear view of how well utilised your team are. Use this information to make informed decisions, allocate resources strategically, and ensure that each channel and activity is receiving the attention it deserves while staying in control of your budgets.
Get insight into your scheduling
Remove the administrative burden of reporting and capacity planning, and save yourself time to use on more effective and impactful work. Start riding the waves of customer support with Surfboard.
Book a demo with our team to find out how Surfboard’s suite of tools can help your organisation realise their goals.
Book a demo