How to Enhance Forecasting in Your Contact Centre


Natasha Ratanshi-Stein , Founder & CEO
Improving your contact centre forecasting can help improve your service levels, customer satisfaction and agent happiness – we take a look at how you can improve your forecasting accuracy (and why you should).
Forecasting in a support team has a certain magic to it with multiple downstream effects.
It impacts hiring in the mid to long term, how you manage outsourcing agencies, and the specific hourly tasks your team works on. We like to describe forecasting contact centre inflow as similar to forecasting the weather. A difference between 21 degrees and 22 degrees isn’t going to make a huge difference, but you need to know if you need an umbrella or sunglasses.
Similarly, forecasting for a contact centre matters so you know how many people you need to meet your service level agreements (SLAs) and delight your customers with a quick response time.
Why forecast?
Without forecasting in place, you have no way of knowing how many people you need online to meet your target response time; or SLAs.
Missed SLAs result in low customer satisfaction (CSAT), reduced net promoter scores (NPS), complaints and in the worst case, customer churn. In some industries, you may even cause complaints to external bodies such as the ombudsman and / or fines from a regulator. 40% of customers report that they would stop transacting with a brand because of a poor customer service experience.
The challenge of forecasting is obvious to anyone, even those without contact centre experience. As a customer, when you have to wait a long time to get through to cancel your flight booking or return a clothing item, it is likely the brand you are trying to contact either has not accurately forecasted or despite forecasting correctly didn’t have enough people online to provide adequate service. This is the exact problem Surfboard is built to solve.
How forecasting works
We refer to forecasting as determining how many contacts you expect to receive from your customers. This refers predominantly to inflow, meaning inbound contacts which are out of your control.
You can also layer on outbound tasks such as outbound calls, callbacks or admin tasks to enhance forecasting. These are predictable though, so you have the ability to decide the best time to complete these tasks. With inbound contacts, you are battling hitting your SLAs to avoid long wait times.
Historical trends often paint only part of the picture to help you forecast your inflow depending on how stable your business is. You’ll see in your industry certain patterns that emerge such as days of week that tend to be busier, times of day and months of the year. You might have a monthly billing cycle where the few days following customers receiving their bill tend to be busier than the rest of the month. Equally, if you’re in retail or e-commerce, the month around Black Friday and Christmas might be substantially busier than the rest of the year. Historical trends will give you a good idea of how much these events result in more inflow.
You might not get the full picture from historical trends though. Often within your business you know things that aren’t evident in the patterns visible in your telephony or ticketing system. These include marketing campaigns that are planned, product launches or price changes. In order to forecast for these events. you need to have an idea of the percentage uplift in inflow you expect to receive. With a good forecasting system in place, you can tag previous events so that when they happen again you have a good idea of what the uplift in inflow will be. Getting this right involves a mixture of business knowledge and collaboration with other functions such as marketing, product and finance; alongside agile external tools that allow you to customise predicted contact volumes based on internal business intelligence.
Long and short term forecasting
Forecasting matters in the short term and the long term. For longer periods of time, the data is used mostly for resource planning such as managing outsourcing agencies (BPOs) and hiring plans. You may use long term forecasts to plan ahead for big events such as holidays to make sure you have enough people working overtime or sufficient capacity from external providers to manage your peaks. In the short term, forecasting is essential to cover who needs to be working on what channel, language or case topic throughout the day and to optimise when your team should be taking breaks, working on admin tasks or benefiting from development and training time.
Converting ticket volume forecasts to staffing requirements
Forecasting isn’t complete just by knowing your ticket volumes. You need this to turn into staffing requirements to know how many people you will need. This isn’t a trivial exercise and varies depends on whether the tickets are responded to in real time or over a longer period of time.
What is the Erlang C calculator?
The Erlang C calculator is the most popular way of calculating how many people you need to cover a live channel by converting ticket volumes and average handle time to a staffing requirement.
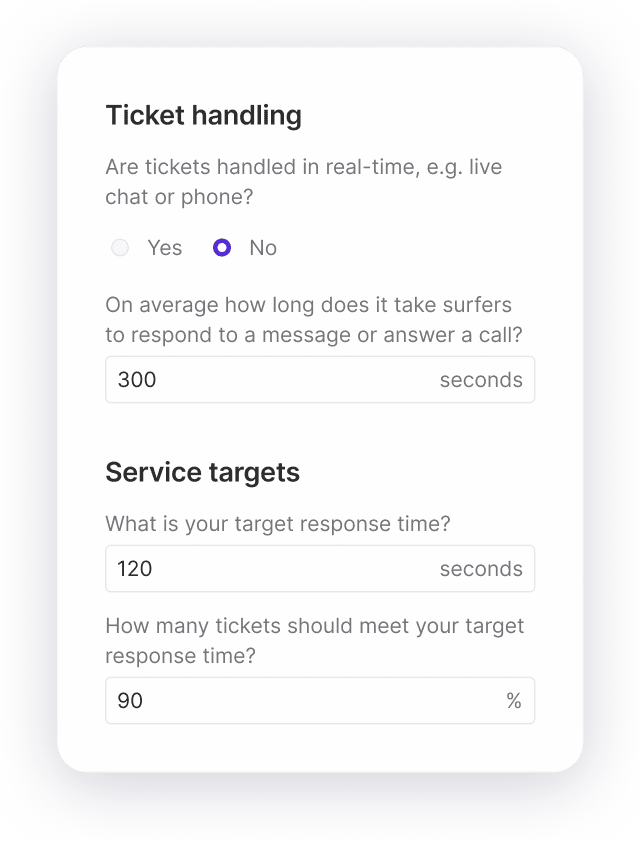
The Erlang C model was first devised for switchboards to monitor traffic and assess the probability of a queue developing. The inputs required for the Erlang C calculator are your SLA (target response time), Service Level % (the percentage of contacts you want to respond to within your target response time), average handle time (how long it takes to handle a contact excluding wait times) and ticket volumes.
The Erlang calculator can be visualised with the following formula (complex, we know!)

Thankfully, tools like Surfboard have the Erlang calculator baked into our product so you can enter the inputs and we do the calculation for you.
How does Erlang C differ from Erlang A?
The A in Erlang A stands for abandons. This accurately reflects how the Erlang A calculation differs form Erlang C. Erlang A calculates the number of people who will abandon their call before the call is picked up by an agent.
In addition to your SLA, you also include the average patience of your customers. Patience differs by industry – you might see that patience is much higher for industries such as utilities, airlines and government services and much lower in industries such as e-commerce and food delivery.
Erlang A isn’t popular in contact centre staffing because it underestimates the number of people you need by only taking into account abandoned calls. This is why Surfboard uses the Erlang C as an input into scheduling.
How to make forecasting simple and smart
Forecasting and capacity planning on spreadsheets is a chore. That’s why Surfboard exists to streamline and automate these processes.
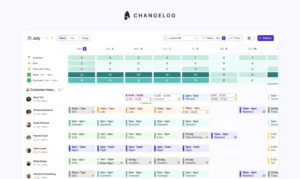
All you need to do is connect to your ticketing system, classify your ticket groups based on how your team works, and input your SLA and average handle time. Surfboard then creates your ticket volume forecast by ticket group and staffing requirements. Our schedules include the staffing requirements at the bottom so you can always visualise whether your service levels are at risk.
Interested in a better forecasting solution?
Leave some details below and we’ll be in touch before the tides goes out.