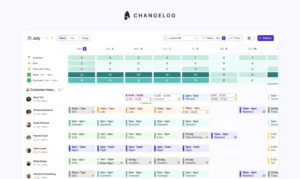
Create more efficient, well balanced schedules with the coverage heatmap

Shannon Ashley , Design lead
Following on from the success of our recent release, Schedule Insights, which offers deep, actionable insights into customer support scheduling, shrinkage and service targets, we’re proud to announce our latest addition, the coverage heatmap.
We often hear from teams that a lack of visibility is one of their biggest challenges when it comes to managing a customer support team. In order to manage a team and budget efficiently, you need to understand where your strengths and weaknesses are.
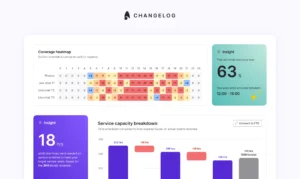
Coverage is a key indicator of how well you’re scheduling, and lets you identify where service will be good or bad. Our new coverage heatmap tool lets you visualise your coverage across channels, days, weeks and teams in one simple, easy to read view. Let’s dive in:

Spot staffing gaps at a glance
Fixed shift patterns can offer great work/life balance and reliability for surfers, but they can be detrimental to your business if they’re not often reviewed. Our coverage heatmap lets you easily visualise over and understaffing across hours, days and weeks so you can refine your schedules, ensuring you truly have the right surfers on at the right times.
You may also want to consider adopting more flexible ways of working, to better schedule surfers at the times you need them most. Scheduling split shifts, collecting availability and preferences are great ways to schedule more efficiently in a way that also benefits your team.

Create a more consistent customer experience
Your customers deserve top-tier support no matter when they get in contact. Ensuring even levels of coverage, is a key way to offer a consistent experience, even if you are understaffed. This way your targets should be less volatile and more predictable, allowing you to better prepare.
You can easily identify these patterns using our simple colour-coded heatmap, showing the delta between your forecasted required number of surfers compared to the schedule. You can further dig into the details by filtering by team, giving you insight into how each team lead is scheduling.

Improve your strategic planning
Need to expand your team? Or perhaps explore outsourcing options? Our heatmap provides invaluable insights to guide your strategic decisions.
As well as checking your planned schedules, you can also view your historical schedules and results too – so you can learn what worked well, or badly, and feed that into your planning process.
You can review the coverage of your planned schedules to identify the gaps that need to be plugged by outsourced teams, making your monthly reviews that little bit simpler. Or you can consider some alternative scheduling styles, such as the 4/10 method, 9/80 schedule or adopt a follow the sun model.
Get insight into your scheduling
Remove the administrative burden of reporting and capacity planning, and save yourself time to use on more effective and impactful work. Start riding the waves of customer support with Surfboard.
Book a demo with our team to find out how Surfboard’s suite of tools can help your organisation realise their goals.